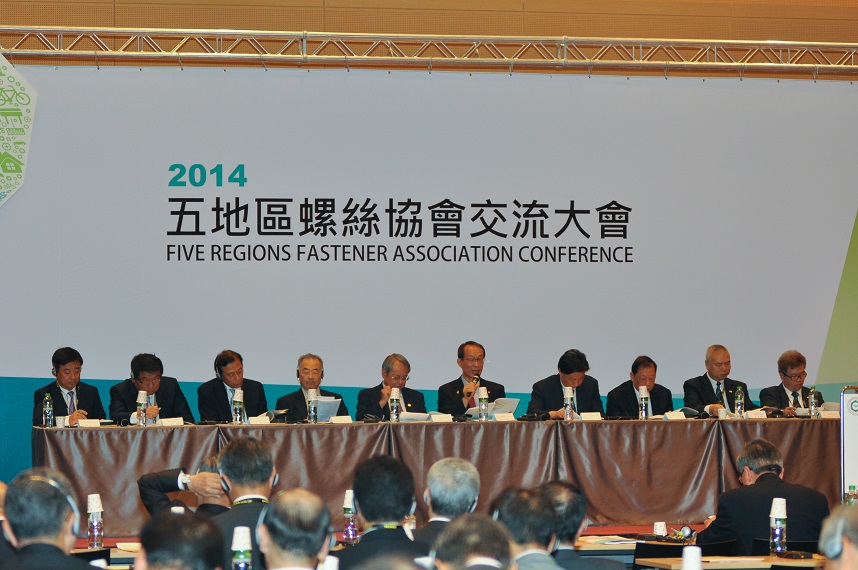
Five Regions Fastener Association Conference 2014

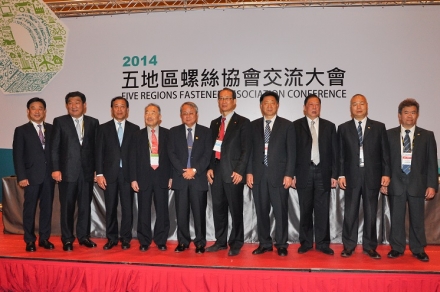
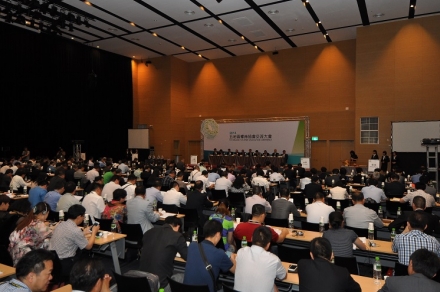

Five Regions Fastener Association Conference 2014
Taiwan, China, Japan, and S. Korea Grow in Export, While Hong Kong Drops in Export Volume but Grows in Export Value
by Tanya Shih, Fastener World Inc.
According to trade statistics, Taiwan, China, Japan, and S. Korea demonstrate growth in export. In contrast, Hong Kong drops in export volume but grows in export value. This trend signifies that Hong Kong’s fastener industry is heading for high value.
After the 1st edition of Five Regions (Taiwan, China, Hong Kong, Japan, and Korea) Fastener Association Conference was held in Taiwan in 2003, the conference continues to take place annually in turn by each region. In 2014, the 14th edition of the conference returned to Taiwan again. It took place in Kaohsiung on April 13. About 250 guests and representatives attended this grand event, including chairmen and presidents of associations as well as corporate representatives.
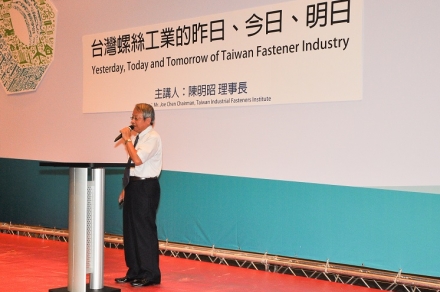
Joe Chen, the organizer and chairman of Taiwan Industrial Fasteners Institute (TIFI), set the topic of this conference as “the condition report of the fastener industry in each region”, lectured by representatives of associations from Taiwan, China, Hong Kong, Japan, and S. Korea. Next, Joe Chen spoke on the topic “Yesterday, Today, and Tomorrow of Taiwan Fastener Industry”. Below are the excerpts from the reports.
Taiwan Industrial Fasteners Institute
Speakers: Chairman Joe Chen and Thompson T. H. Chang
“Export volume in 2013 reached a new record of 1.46 million tons, with the unit price for export to Japan being the highest at USD3.1/kg.”
Taiwan’s fastener export is greatly related to the global economic development. Chairman Chen said, “After 5 years of adjustment in the global economic development, the industry has stepped into a new process in 2014 and the advanced economies like EU, USA, and Japan have been out of the bottom of the financial crisis, showing powerful growth momentum. Plus, the domestic demand in emerging markets continues to grow, so it is expected that Taiwan’s fastener export will show a stable growing trend.
Table 1. Taiwan’s Fastener Export During 2005-2013
|
Year |
Volume (KG) |
Value (USD) |
Unit Price (USD/KG) |
|||
|
Volume |
YoY(%) |
Value |
YoY(%) |
Unit Price |
YoY(%) |
|
|
2005 |
1,265,569,015 |
-10.33% |
2,499,154,951 |
4.78% |
1.975 |
16.85% |
|
2006 |
1,269,647,531 |
0.32% |
2,571,148,828 |
2.88% |
2.025 |
2.55% |
|
2007 |
1,231,081,767 |
-3.04% |
2,900,413,415 |
12.81% |
2.356 |
16.34% |
|
2008 |
1,215,061,132 |
-1.30% |
3,163,761,842 |
9.08% |
2.604 |
10.52% |
|
2009 |
895,144,189 |
-26.33% |
2,070,049,250 |
-34.57% |
2.313 |
-11.19% |
|
2010 |
1,279,454,975 |
42.93% |
3,214,618,211 |
55.29% |
2.512 |
8.65% |
|
2011 |
1,422,005,953 |
11.14% |
3,973,545,681 |
23.61% |
2.974 |
11.22% |
|
2012 |
1,379,473,662 |
-2.99% |
3,798,043,334 |
-4.42% |
2.753 |
-1.47% |
|
2013 |
1,459,394,488 |
5.79% |
3,861,744,023 |
1.68% |
2.646 |
-3.89% |
Source: TIFI
In 2013 Taiwan’s fastener export favored by the economic recovery showed 5.8% increase in volume to 1.46 million tons and grew 1.7% in value to USD3.86 billion. The unit price dropped 3.89% to USD2.646/kg due to the slip of global steel prices.
The top 5 export destinations of Taiwan’s fasteners in volume in 2013 were the U.S. (0.58 million tons, accounting for 39%), Germany (0.13 million tons, 8.4%), Japan (77 thousand tons, 5.3%), the Netherlands (76 thousand tons, 5.2%), UK (55 thousand, 3.8%). Among the top 5 countries, Japan marks the highest unit price of USD3.1/kg while the unit price for the other 4 countries is between USD2.45-2.69/kg.
In terms of the specific fastener export items in 2013, “other screws and bolts” totaling 0.81 million tons represents 55.72% of the total share, “nuts” totaling 0.26 million tons are 18.10% of the total share, and “self-tapping screws” totaling 0.15 million tons are 10.54% of the total share. These products are the top 3 exported fasteners of Taiwan.
Mr. Thompson T. H. Chang said, “There exists a wide range of difference in the unit prices of Taiwan’s fastener import and export. Most of the import are high-value added screws for automotive and construction applications and the unit price is up to USD 6, while most of the products for export are standard goods. Recently the export of automotive screws has been flourishing, which greatly helps increase the unit price of export.”
Taiwan’s fastener export in 2013 recovered to growth, mainly due to the increase in export to the EU, USA, and Japan. The European debt crisis so far shows a sign of gradual improvement. The EU is a major market for Taiwan’s fastener export, which generates the expectation for higher Taiwan’s fastener export to the EU in 2014. In U.S. market, its employment continues to turn well, the PMI for manufacturing increases, and automotive and machinery industries are growing, so the fastener export from Taiwan to the U.S. is expected to grow continuously.
China General Machine Components Industry Association (Fastener Sub Association
Speakers: Executive Vice Chairman Chang Ming Wang and Chairman Jin Yao Feng
“Major indices for industries in China are within the expected intervals and the fastener industry keeps its slight and steady growth.”
Executive Vice Chairman Wang addressed in the conference, “Chinese economy has been through a long period of fast growth and has recently come to the adjustment. The growth of the entire machinery industry including the components industry has been slowing down. In 2013 the growth in sales of the general components industry was only 6.6% while the growth of the fastener industry was even lower than 3%, which were attributed to the restricted export, the low demand of the domestic market, the fast increasing labor cost, and the control over environmental resources. Only when the fastener companies utilize the changing mechanism in the market can they realize the result of going “from the mid-to-low end to the mid-to-high end, from a fast growing type to quality seeking type, and from loose management to concentrated management.” With the support of industrial policies promoted by the government, I believe Chinese fastener industry still shows a bright prospect for future development.
Table 2. Fastener Import & Export of China During 2011-2013
|
Year |
Export |
Import |
||||
|
Weight (KG) |
Value (USD) |
Unit Price (USD/KG) |
Weight (KG) |
Value (USD) |
Unit Price (USD/KG) |
|
|
2011 |
2,589,231,409 |
4,663,911,600 |
1.801 |
264,040,084 |
2,938,465,900 |
11.129 |
|
2012 |
2,463,977,813 |
4,512,208,300 |
1.831 |
251,525,543 |
2,872,707,000 |
11.421 |
|
2013 |
2,558,554,039 |
4,604,220,000 |
1.800 |
273,194,951 |
2,999,156,900 |
10.978 |
Source: CMCA (Fastener Sub Association)
In 2013 the fastener trade volume of China reached 6.8 million tons with the YoY ratio being 3.03%. Thesales of fasteners were RMB67.5 billion (USD 10.8 billion) with the YoY ratio being 3.85%. The fastenerexport volume reached 2.558 million tons (steel products) with the YoY ratio being 3.81%. The exportvalue was USD4.604 billion with the YoY ratio being 2.04%. The import volume were 0.273 million tons(steel products) with the YoY ratio of 8.55%. The export value was USD2.999 billion with the YoY ratiobeing 4.49%.
Chairman Feng said, “China is still suffering the structural adjustment. In 2014 the situation of Chinese economy continues to be complicated with the coexistence of favorable and unfavorable factors. Nevertheless, The important industrialization and urbanization of China both provide the fastener industry with certain bases and conditions to have their say.”
The steps for adjustment can be reliance on the development of high-strength, high-precision, and high value added industries like automobiles, new energy, high speed rails, aerospace, environmental protection, infrastructure, metropolitan transport, and IT, all of which require the upgrade of techniques and even the transformation of business operation. Feng added, “The R&D of energy saving, new EP technology, promotion of energy consumption standards, eco-plating, e-commerce and online marketing platform are all the ways we have to go on.” The production in 2014 is expected to reach 7 million tons including 2.5 million tons of export.
Hong Kong Screw & Fastener Council
Speakers: Chairman Zhi Ming Lin and Executive Vice Chairman Kin Ming Cheung
“Export volume dropped while export value hiked, showing the trend of high added value”
In 2013, the export volume of Hong Kong declined 7% from last year to 26,620 tons, which has been a slip for 3 consecutive years but an increase in the export value for 4 consecutive years. In 2013, the export value climbed 14% to USD0.43 billion. These figures show that the fastener industry of Hong Kong is going toward high added value.
Table 3. Fastener Import & Export of Hong Kong During 2009-2013
|
Year |
Export |
Import |
||||||
|
Volume (KG) |
YoY(%) |
Value (USD) |
YoY(%) |
Volume (KG) |
YoY(%) |
Value (USD) |
YoY(%) |
|
|
2009 |
30,057,860 |
7% |
283,043,800 |
-10% |
60,382,057 |
20% |
275,610 |
-19% |
|
2010 |
32,849,690 |
9% |
370,494,100 |
31% |
44,189,532 |
-27% |
332,099 |
20% |
|
2011 |
30,735,000 |
-6% |
373,845,900 |
1% |
45,481,950 |
3% |
324,603 |
-2% |
|
2012 |
28,720,230 |
-6% |
386,042,700 |
3% |
47,583,910 |
4% |
324,339 |
-0.08% |
|
2013 |
26,620,000 |
-7% |
439,080,100 |
14% |
45,299,699 |
-5% |
344,056 |
6% |
Source: Hong Kong Screw & Fastener Council
Executive Vice Chairman Chang said, “China is still the largest export destination of Hong Kong, with itsexport volume and export value being 46% and 71% respectively (a slight drop from last year due to thesubstantial increase in production and operating costs that caused the hike of fastener prices.)
As for the import, in 2013 the total fastener import of Hong Kong declined 5% from the corresponding period to 45,299 tons while the import value grew 6% from the corresponding period to USD0.34 billion, which is a condition similar to export (i.d. the import volume dropped but the import value increased). China is still the largest origin of import with the import volume and import value being 77% and 45% respectively.
The association thinks that the drop of import and export volumes was influenced by the downturn of the global economy, especially Europe and USA. At the same time, the appreciated Chinese yuans and euros against Hong Kong dollars caused the import and export values to increase, plus the pressure from labor cost and rental, all cutting down the competitiveness of prices offered by Hong Kong fastener industry. Accordingly, Chairman Lin said, “Hong Kong fastener industry has to utilize its advantages in manufacturing technology and quality control to meet the various demands for fasteners of industries and create a new way for the future.”
The Fasteners Institute of Japan –– Chairman Hirotada Takenaka & Chairman for Committee on International Affairs Okawa Katsuyoshi
“Abenomics, depreciated yens, and increased consumption tax caused slowdown of facility investment and relocation of production base, saffecting the ups and downs of Japanese fastener industry.”
Generalizing the Japanese fastener industry in 2013, statistics from The Fasteners Institute of Japan show that Japan produced 2.875 million tons, down 3%, while production value remains flat at 837.117 billion yens (around USD 8.523 billion). This means reduced capacity and flat production value.
Table 4. 2011-2013 Japan’s Fastener Capacity
|
Year |
Volume (Ton) |
YoY (%) |
Value (Million yens) |
YoY (%) |
Value (USD 1,000) |
YoY (%) |
Exchange Rate (USD / JPY, as of Sep. 30) |
|
2011 |
2,767,136 |
-3.5% |
789,255 |
-2.4% |
10,244,743 |
5.7% |
77.04 |
|
2012 |
2,962,263 |
7.1% |
837,249 |
6.1% |
10,747,741 |
4.9% |
77.90 |
|
2013 |
2,877,490 |
-2.9% |
837,117 |
0% |
8,523,745 |
-20.7% |
98.21 |
Source: The Fasteners Institute of Japan
Relocation of production bases is the main factor that slows Japan’s fastener capacity to a lower level, but on the other hand it drives up the import volume. In 2013 the import volume rose 12% to 254 thousand tons, and the import value climbed 28.1% to 83.7 billion yens (around USD 852.25 million). Statistics show that in 2013 Japan imported 148,547 tons of bolts and nuts from China (accounting for 58.6%), 74,233 tons from Taiwan (29.3%), and 10,353 tons from S. Korea (4.1%). These figures signify high proportion of import.
In terms of export, the depreciated yens did not boost growth margin as expected, but it more or less increased price competitiveness. In 2013, Japan exported 331 thousand tons of fasteners, up 2.5%, and export value grew 11% to 275.2 billion yens (around USD 2.83 billion).
Table 5. Fastener Import & Export of Japan During 2011-2013
|
Year |
Export |
Import |
||||||
|
Volume (Ton) |
YoY (%) |
Value (Million yens) |
YoY (%) |
Volume (Ton) |
YoY (%) |
Value (Million yens) |
YoY (%) |
|
|
2011 |
304,993 |
-1.8% |
231,915 |
-1.6% |
217,921 |
10.8% |
63,982 |
11.8% |
|
2012 |
322,307 |
5.7% |
247,905 |
6.9% |
226,401 |
3.9% |
65,348 |
2.1% |
|
2013 |
330,506 |
2.5% |
275,286 |
11.0% |
253,649 |
12.0% |
83,700 |
28.1% |
Source: Ministry of Finance Japan
As numerous economic policies have affected Japanese fastener industry since 2013, Okawa Katsuyoshi, Chairman for Committee on International Affairs, thinks Japan still stands at a critical point of economic revival. Even at the end of March 2014, the industry as a whole still operates at a lower level. Chairman Takenaka states, “In our industry, fastener makers in business with the reviving automotive industry are receiving increasing purchase orders. In contrast, those in business with sluggish industries are still striving through hard times.”
Korea Federation of Fasteners Industry Cooperatives –– Chairman Jin-Sun Auh & Director Jung-Woo Lee
“Korean fastener capacity is highly related to the level of automotive industry. Automotive fasteners account for 77.4% of total capacity.”
In 2013, Korean fastener import value grew 16.7% to USD 520 million, and export value grew 11.3% to USD 670 million. In Korea, the automotive industry demands 750 thousand tons (accounting for 77.4%) of fasteners, the construction industry demands 130 thousand tons (13.5%), the electronics industry demands 20 thousand tons, and other industries demand 70 thousand tons.
Reviewing Korean fastener industry in 2013, Lee states, “Domestic fastener capacity reached 970 thousand tons, and sales reached USD 3.9 billion. Minor decrease in fastener capacity was the result of the reduced capacity of domestic whole car makers. In 2013, Korea produced 5.85 million cars, down 2.4%. Fortunately, demand of the construction market rose 3.6% to USD 89.9 billion and complemented a little for the loss of Korean fastener industry.”
Table 6. 2011-2013 Export of Korean Fasteners
|
Nation |
2011 |
2012 |
2013 |
|||
|
Volume (Ton) |
Value (USD Thousand) |
Volume (Ton) |
Value (USD Thousand) |
Volume (Ton) |
Value (USD Thousand) |
|
|
USA |
34,719 |
109,624 |
37,974 |
137,822 |
43,594 |
156,759 |
|
China |
18,758 |
81,573 |
21,233 |
101,350 |
25,202 |
127,485 |
|
Japan |
12,507 |
50,351 |
12,442 |
49,861 |
13,912 |
48,430 |
|
Czech |
4,135 |
14,299 |
6,171 |
25,410 |
5,412 |
25,497 |
|
India |
3,592 |
15,214 |
4,314 |
20,034 |
5,799 |
25,266 |
|
Total |
121,576 |
484,737 |
140,570 |
606,526 |
156,914 |
674,807 |
Source: Korea Iron & Steel Association
Note: In descending of 2013 export value
Table 7. 2011-2013 Import of Korean Fasteners
|
Nation |
2011 |
2012 |
2013 |
|||
|
Volume (Ton) |
Value (USD Thousand) |
Volume (Ton) |
Value (USD Thousand) |
Volume (Ton) |
Value (USD Thousand) |
|
|
China |
90,090 |
158,275 |
97,532 |
164,660 |
107,461 |
180,185 |
|
USA |
3,206 |
104,524 |
3,446 |
101,542 |
4,119 |
126,324 |
|
Germany |
2,544 |
32,543 |
2,671 |
35,683 |
2,615 |
49,366 |
|
Taiwan |
8,321 |
28,915 |
6,758 |
27,651 |
7,087 |
24,685 |
|
Japan |
1,875 |
37,694 |
2,999 |
32,378 |
1,143 |
21,033 |
|
Total |
113,540 |
436,702 |
121,792 |
446,478 |
131,834 |
520,998 |
Source: Korea Iron & Steel Association
Note: In descending of 2013 import value
Chairman Jin-Sun Auh states, “After a long time of depression, the world economy started to recover at the end of 2013. Although the growth is slow and cannot bring immediate growth to 2014. We expect the world economy to bring positive affect to the fastener industry.”


